W3C-validity not checked.
概要
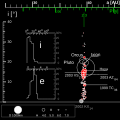
Orbit Distribution for plutinos. (voir plus loin pour la description en français)
Objects not classified by the current MPEC Circular as plutinos (see Data Sources below) are plotted in grey and not taken into account for the histograms.
Main graph
The position of an object represents
- its orbit’s semi-major axis a in AU (horizontal axis)
- orbit’s inclination i in degrees (vertical axis).
The size of the circle illustrates the object’s size relative to others. For the biggest three: Pluto, 90482 Orcus and 28978 Ixion the diameter drawn represents the best current estimates. For all others, the circles represent the absolute magnitude of the object.
The eccentricity of the orbit is shown indirectly by a segment extending from the left (perihelion) to the aphelion to the right. In other words, the segment illustrates the variations of the object's distance from the Sun. Objects with nearly circular orbits will show short segments while highly elliptical orbits will be represented by long segments.
Histograms
Histograms show the population of objects with the parameter (eccentricity e and inclination i respectively) inside the given interval. The population is expressed in % of the total population (vertical axis)
- for inclination, the interval is 5o, i.e. the first bar shows the relative population of objects with i in 0-5o range, the next in 5-10o range etc.
- for the eccentricity e, the interval is 0.1, i.e. the first bar shows the relative population of objects with e in 0-0.1 range (quite circular orbits)
Data source
Minor Planet Center Orbit database (MPCORB) as of 2008-10-05. Resonant orbits' classification from MPEC Circular 2008-S05 (2008-10-01).
Description en français
La distribution des orbites des plutinos. Graphe généré par un programme écrit par Eurocommuter.
Graphe principal
La position d’un objet représente
- le demi axe majeur (rayon moyen) de son orbite a en au (unité astronomique, l'axe horizontal)
- l’inclination de son orbite i en degrés (axe vertical).
Le diamètre du cercle montre la taille relative de l’objet aux autres. Pour quelques grands objets, le diamètre représente la meilleure estimation connue. Pour tous les autres, le diamètre du cercle représente la magnitude absolue de l’objet.
L’excentricité de l’orbite est représentée indirectement par un segment qui s’étend du périhélie à gauche) l’aphélie à droite. En d’autres termes, le segment illustre les variations de la distance du Soleil. Les objets avec des orbites quasi circulaires ont donc des courts segments et les orbites très excentriques sont repérées par des segments longs.
Les positions des résonances avec Neptune sont marqués par des traits verticaux; 1:1 marque la position de l’orbite de Neptune (et ses Troyens), 2:3 marque l’orbite de Pluton (et ses lunes) etc.
Histogrammes
Les histogrammes montrent la population d’objets avec un paramètre donné (excentricité e et inclinaison i respectivement) avec sa valeur à l’intérieur d’un intervalle. Les populations sont exprimées en % du nombre total des objets considérés (axe vertical)
- pour l’inclinaison i, l’intervalle est de 5o, c. à. d. le premier bar montre le pourcentage d’objets avec i entre 0 et 5o, le suivant entre 5 et 10o etc.
- pour l’excentricité ‘’’e’’’, l’intervalle est de 0,1 c. à. d. le premier bar montre le pourcentage d’objets avec e entre 0 et 0,1 (orbites relativement circulaires)
Source des donnés
La base de donnés MPCORB au 21 Octobre 2008.
Classification: MPEC Circular 2008-S05 (2008-10-01).
ライセンス


