
ファイル:Graph of average growth rate of EU countries and Euro zone.png
高解像度版はありません。
Graph_of_average_growth_rate_of_EU_countries_and_Euro_zone.png (726 × 332 ピクセル、ファイルサイズ: 24キロバイト、MIME タイプ: image/png)
ウィキメディア・コモンズのファイルページにある説明を、以下に表示します。
|
概要
| 解説 |
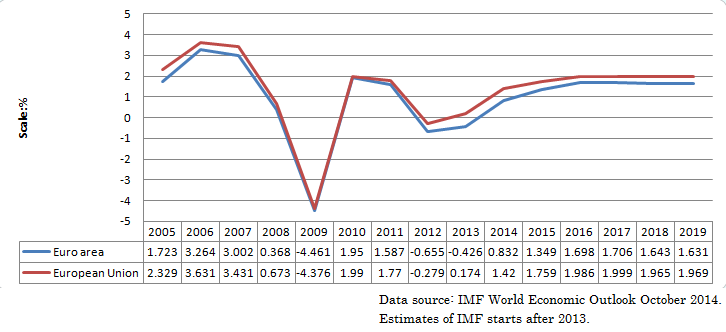
English: This is a graph of growth rate of EU countries and Euro zone (Growth rate of Real GDP). Data source is International Monetary Fund, World Economic Outlook Database October 2014.Estimates (of IMF) starts from 2013. The calculation is done by IMF. The calculation of average is done by myself in version 21:29, 4 November 2014. After this version, the calculation is done by IMF. |
| 日付 | |
| 原典 | I made this graph from IMF database, using EXCEL 2007. |
| 作者 | ShuBraque |
ライセンス
この作品の著作権者である私は、この作品を以下のライセンスで提供します。

|
この文書は、フリーソフトウェア財団発行のGNUフリー文書利用許諾書 (GNU Free Documentation License) 1.2またはそれ以降のバージョンの規約に基づき、複製や再配布、改変が許可されます。不可変更部分、表紙、背表紙はありません。このライセンスの複製は、GNUフリー文書利用許諾書という章に含まれています。 |
このファイルはクリエイティブ・コモンズ 表示-継承 3.0 非移植ライセンスのもとに利用を許諾されています。
- あなたは以下の条件に従う場合に限り、自由に
- 共有 – 本作品を複製、頒布、展示、実演できます。
- 再構成 – 二次的著作物を作成できます。
- あなたの従うべき条件は以下の通りです。
- 表示 – あなたは適切なクレジットを表示し、ライセンスへのリンクを提供し、変更があったらその旨を示さなければなりません。これらは合理的であればどのような方法で行っても構いませんが、許諾者があなたやあなたの利用行為を支持していると示唆するような方法は除きます。
- 継承 – もしあなたがこの作品をリミックスしたり、改変したり、加工した場合には、あなたはあなたの貢献部分を元の作品とこれと同一または互換性があるライセンスの下に頒布しなければなりません。
あなたは上記のライセンスから、どれか一つ以上を選択できます。

|
この画像のカテゴリは再検討が必要です。今すぐ再検討する
|
ファイルの履歴
過去の版のファイルを表示するには、その版の日時をクリックしてください。
| 日付と時刻 | サムネイル | 寸法 | 利用者 | コメント | |
|---|---|---|---|---|---|
| 現在の版 | 2014年11月4日 (火) 21:55 | | 726 × 332 (24キロバイト) | ShuBraque | Added some information about the data. |
| 2014年11月4日 (火) 21:49 |  | 726 × 313 (23キロバイト) | ShuBraque | This is a graph of average growth rate of EU countries and Euro zone (Growth rate of Real GDP). Data source is International Monetary Fund, World Economic Outlook Database October 2014.Estimates (of IMF). Calculation is done by IMF. | |
| 2014年11月4日 (火) 21:29 | 712 × 290 (17キロバイト) | ShuBraque | {{subst:Upload marker added by en.wp UW}} {{Information |Description = {{en|This is a graph of average growth rate of EU countries and Euro zone. Data source is International Monetary Fund, World Economic Outlook Database October 2014.Estimates (of IMF... |
ファイルの使用状況
以下のページがこのファイルを使用しています: