概要
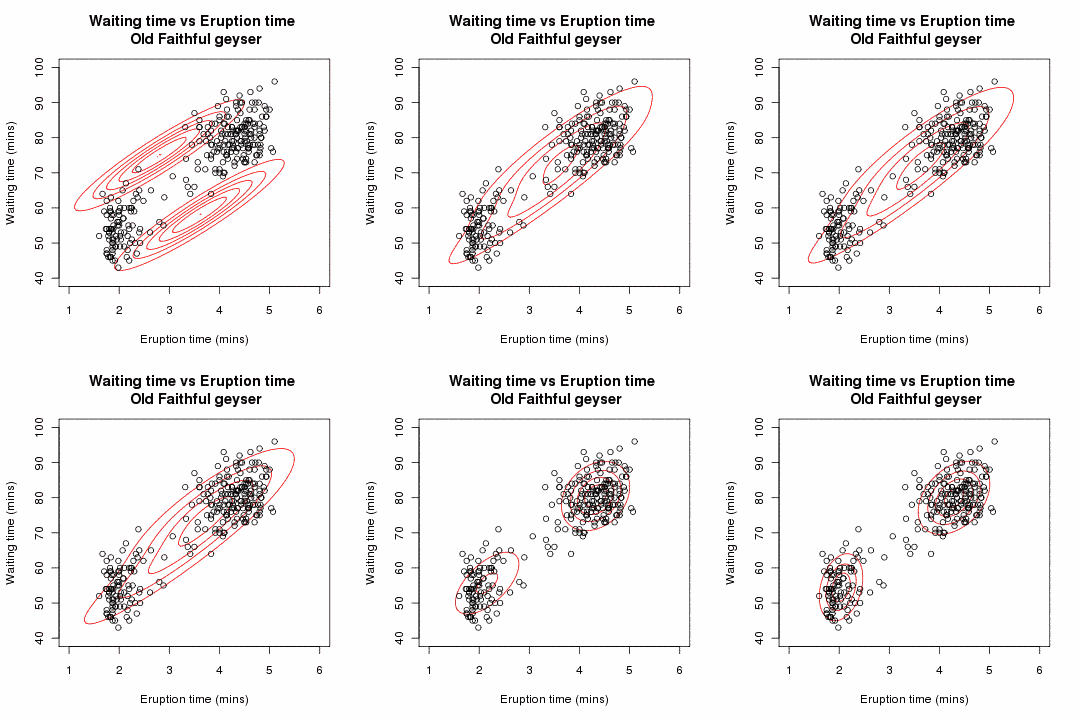
Created in R with code below (released under same license as image), combined into animated gif using ImageMagick.
There should be a way to make this file smaller (e.g. using less colours or an animated PNG). If you can, feel free to upload a new copy.
#load library for multivariate normal
library(mvtnorm)
#load Old Faithful data frame
data(faithful)

#setup grid for plotting
xpts <- seq(from=1,to=6,length.out=100)
ypts <- seq(from=40,to=100,length.out=100)

#initial parameter estimates (chosen to be deliberately bad)
theta <- list(
             tau=c(0.5,0.5),
             mu1=c(2.8,75),
             mu2=c(3.6,58),
             sigma1=matrix(c(0.8,7,7,70),ncol=2),
             sigma2=matrix(c(0.8,7,7,70),ncol=2)
             )

#E step: calculates conditional probabilities for latent variables
E.step <- function(theta)
 t(apply(cbind(
     theta$tau[1] * dmvnorm(faithful,mean=theta$mu1,sigma=theta$sigma1),
     theta$tau[2] * dmvnorm(faithful,mean=theta$mu2,sigma=theta$sigma2)
     ),1,function(x) x/sum(x)))
#M step: calculates the parameter estimates which maximise Q
M.step <- function(T) list(
 tau= apply(T,2,mean),
 mu1= apply(faithful,2,weighted.mean,T[,1]),
 mu2= apply(faithful,2,weighted.mean,T[,2]),
 sigma1= cov.wt(faithful,T[,1])$cov,
 sigma2= cov.wt(faithful,T[,2])$cov)

#function to plot current data
plot.em <- function(theta){
 mixture.contour <- outer(xpts,ypts,function(x,y) {
   theta$tau[1]*dmvnorm(cbind(x,y),mean=theta$mu1,sigma=theta$sigma1) + theta$tau[2]*dmvnorm(cbind(x,y),mean=theta$mu2,sigma=theta$sigma2)
   })
 contour(xpts,ypts,mixture.contour,nlevels=5,drawlabel=FALSE,col="red",xlab="Eruption time (mins)",ylab="Waiting time (mins)",main="Waiting time vs Eruption time of the Old Faithful geyser")
 points(faithful)
}

#plot initial contours
iter <- 1
png(filename=paste("em",formatC(iter,width=4,flag="0"),".png",sep=""))
plot.em(theta)
dev.off()

#run EM and plot
for (iter in 2:30){
 T <- E.step(theta)
 theta <- M.step(T)
 png(filename=paste("em",formatC(iter,width=4,flag="0"),".png",sep=""))
 plot.em(theta)
 dev.off()
}
ライセンス
この作品の著作権者である私は、この作品を以下のライセンスで提供します。
- あなたは以下の条件に従う場合に限り、自由に
- 共有 – 本作品を複製、頒布、展示、実演できます。
- 再構成 – 二次的著作物を作成できます。
- あなたの従うべき条件は以下の通りです。
- 表示 – あなたは適切なクレジットを表示し、ライセンスへのリンクを提供し、変更があったらその旨を示さなければなりません。これらは合理的であればどのような方法で行っても構いませんが、許諾者があなたやあなたの利用行為を支持していると示唆するような方法は除きます。
- 継承 – もしあなたがこの作品をリミックスしたり、改変したり、加工した場合には、あなたはあなたの貢献部分を元の作品とこれと同一または互換性があるライセンスの下に頒布しなければなりません。
https://creativecommons.org/licenses/by-sa/3.0CC BY-SA 3.0 Creative Commons Attribution-Share Alike 3.0 truetrue

|
この文書は、フリーソフトウェア財団発行のGNUフリー文書利用許諾書 (GNU Free Documentation License) 1.2またはそれ以降のバージョンの規約に基づき、複製や再配布、改変が許可されます。不可変更部分、表紙、背表紙はありません。このライセンスの複製は、GNUフリー文書利用許諾書という章に含まれています。http://www.gnu.org/copyleft/fdl.htmlGFDLGNU Free Documentation Licensetruetrue
|
あなたは上記のライセンスから、どれか一つ以上を選択できます。


