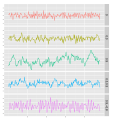
ファイル:ArTimeSeries.svg
表示

この SVG ファイルのこの PNG プレビューのサイズ: 685 × 448 ピクセル. その他の解像度: 320 × 209 ピクセル | 640 × 419 ピクセル | 1,024 × 670 ピクセル | 1,280 × 837 ピクセル | 2,560 × 1,674 ピクセル。
元のファイル (SVG ファイル、685 × 448 ピクセル、ファイルサイズ: 177キロバイト)
ファイルの履歴
過去の版のファイルを表示するには、その版の日時をクリックしてください。
| 日付と時刻 | サムネイル | 寸法 | 利用者 | コメント | |
|---|---|---|---|---|---|
| 現在の版 | 2013年1月15日 (火) 04:28 |  | 685 × 448 (177キロバイト) | Everettr2 | I tried to clarify the identity of each of the five plots in the graph. |
| 2013年1月13日 (日) 20:16 |  | 604 × 448 (167キロバイト) | Everettr2 | Reverted to version as of 22:28, 30 March 2011 | |
| 2013年1月13日 (日) 20:15 |  | 612 × 792 (227キロバイト) | Everettr2 | Trying to clearly identify each of the 5 plots in the graph | |
| 2013年1月13日 (日) 20:14 |  | 604 × 448 (167キロバイト) | Everettr2 | Reverted to version as of 22:28, 30 March 2011 | |
| 2013年1月13日 (日) 19:41 |  | 612 × 792 (192キロバイト) | Everettr2 | Added descriptive elements to better identify each of the five plots in the graphic. | |
| 2011年3月30日 (水) 22:28 |  | 604 × 448 (167キロバイト) | Tomaschwutz | changed to area between zero and line instead of line only | |
| 2011年3月30日 (水) 17:44 |  | 488 × 519 (167キロバイト) | Tomaschwutz | {{Information |Description ={{en|1=Timeseries of several AR(p) processes with standard deviation of the noise of 1}} |Source ={{own}} |Author =Tomaschwutz |Date =2011-03-30 |Permission = |other_version |
ファイルの使用状況
以下のページがこのファイルを使用しています:
グローバルなファイル使用状況
以下に挙げる他のウィキがこの画像を使っています:
- en-two.iwiki.icu での使用状況
- he.wikipedia.org での使用状況
- ko.wikipedia.org での使用状況
- uk.wikipedia.org での使用状況
